import pandas as pd
import numpy as np
import matplotlib.pyplot as plt
import japanize_matplotlib
import seaborn as sns
sns.set(font="IPAexGothic") #日本語フォント設定
train = pd.read_csv('./train.csv')
test = pd.read_csv('./test.csv')
train['y'].plot()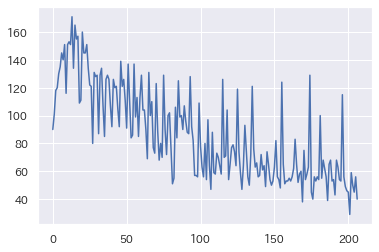
sns.barplot(x="week", y='y', data =train)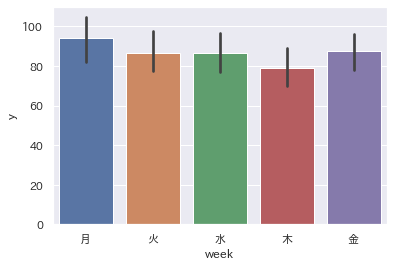
sns.distplot(train['y'])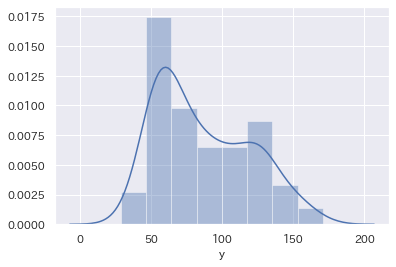
from scipy.optimize import curve_fit

def func(x, a, b, c):
    return a * np.exp(-b * x) + c

xs = train.index.values
ys = train['y'].values

popt, pcov = curve_fit(func, xs, ys)

a1, b1, c1 = popt
y_reg = a1 * np.exp(-b1 * xs) + c1

plt.figure()
plt.plot(train['y'])
plt.plot(y_reg)
new_y = train['y'] - y_reg
new_y = pd.DataFrame({'new_y': new_y})

new_y.plot()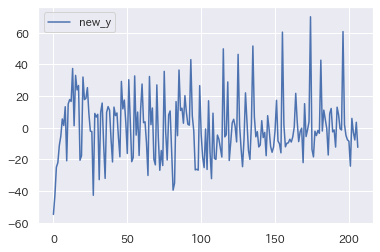
train['new_y'] = train['y'] - y_regtrain['day'] = train['datetime'].apply(lambda x : int(x.split("-")[2]))import plotly.offline as offline
offline.init_notebook_mode(connected=False)
import plotly.graph_objs as go
layout = go.Layout(
autosize=False,
width=950,
height=500,
margin=go.layout.Margin(
l=80,
r=50,
b=50,
t=10,
pad=4),
xaxis=dict(
title='day',
titlefont=dict(
size=14,
),
showticklabels=True,
tickangle=0,
tickfont=dict(
size=12,
),
),
yaxis=dict(
title='トレンドを除いた販売数',
titlefont=dict(
size=14,
),
showticklabels=True,
tickfont=dict(
size=10,
),
))
data = [go.Box( x=train['day'], y=train['new_y'] )]
fig = go.Figure(data=data, layout=layout)
offline.iplot(fig, filename='example', show_link=False,
config={"displaylogo":False, "modeBarButtonsToRemove":["sendDataToCloud"]})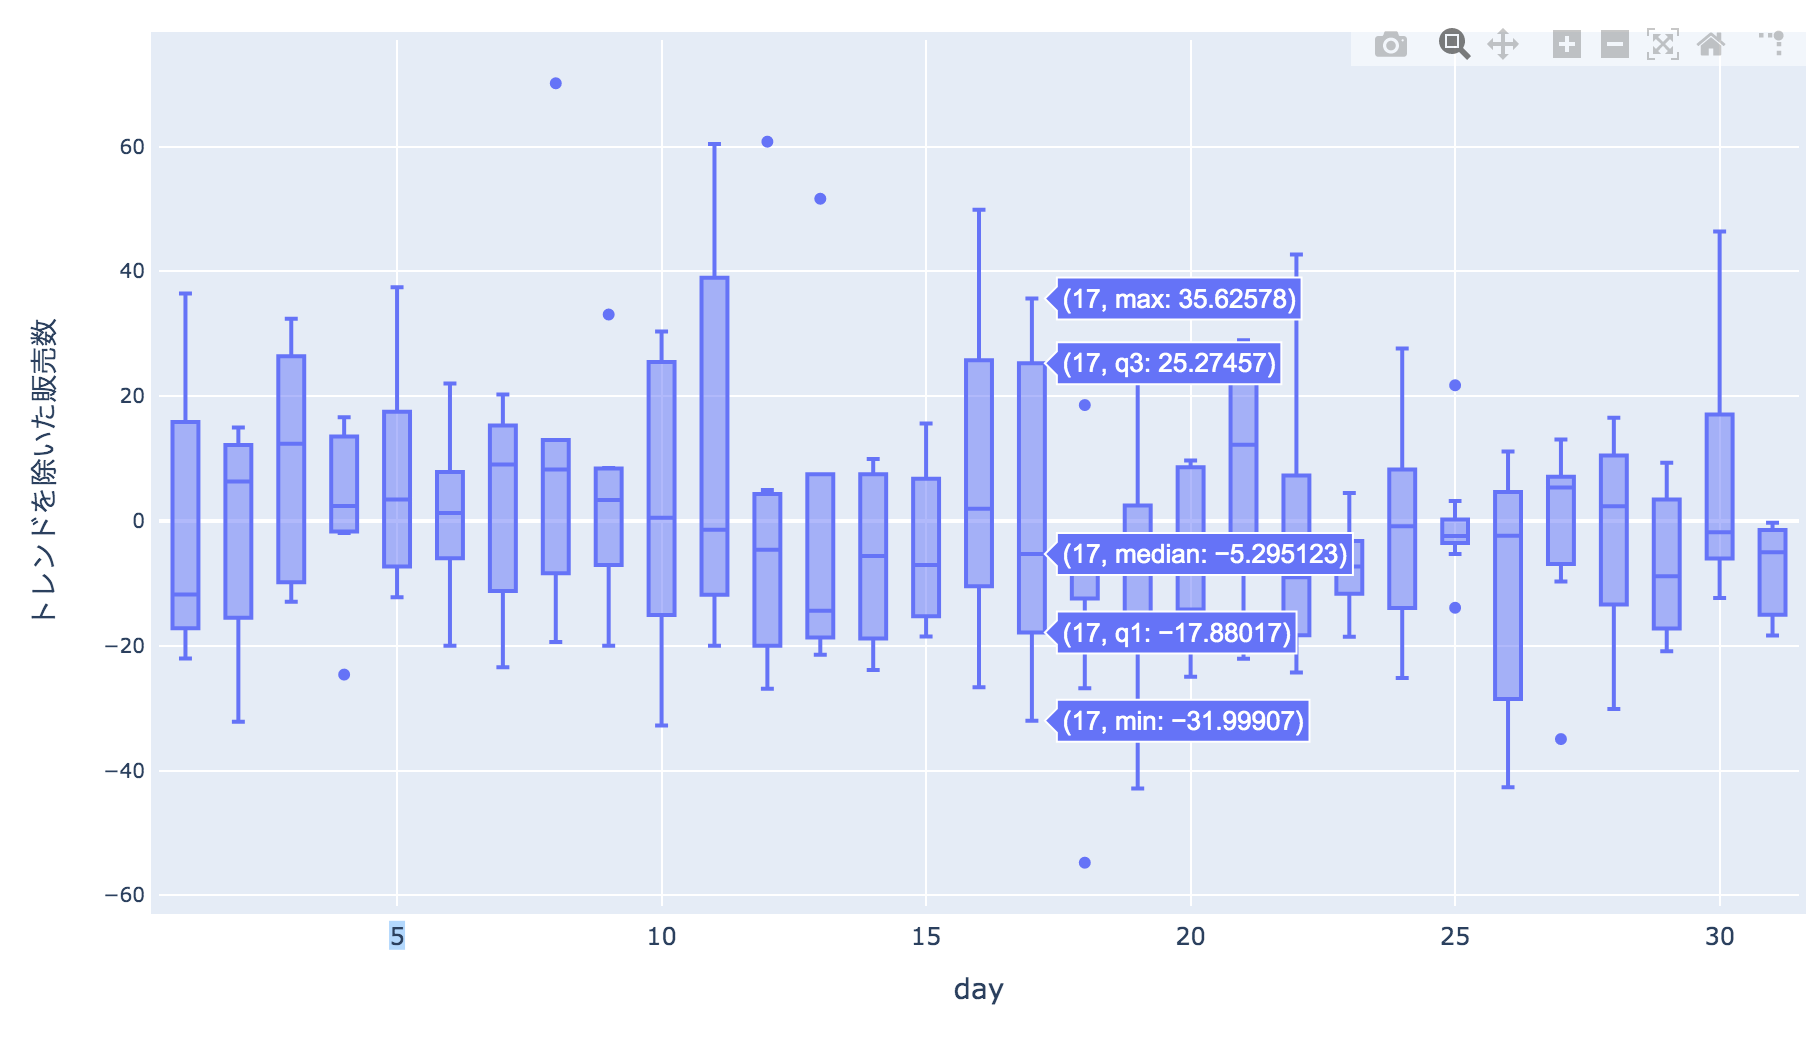
week_encoded = train.groupby('week').new_y.median()train['week'] = train['week'].replace(week_encoded) tickangle=90data = [go.Box( x=train['name'], y=train['new_new_y'] )]
fig = go.Figure(data=data, layout=layout)
offline.iplot(fig, filename='example', show_link=False,
config={"displaylogo":False, "modeBarButtonsToRemove":["sendDataToCloud"]})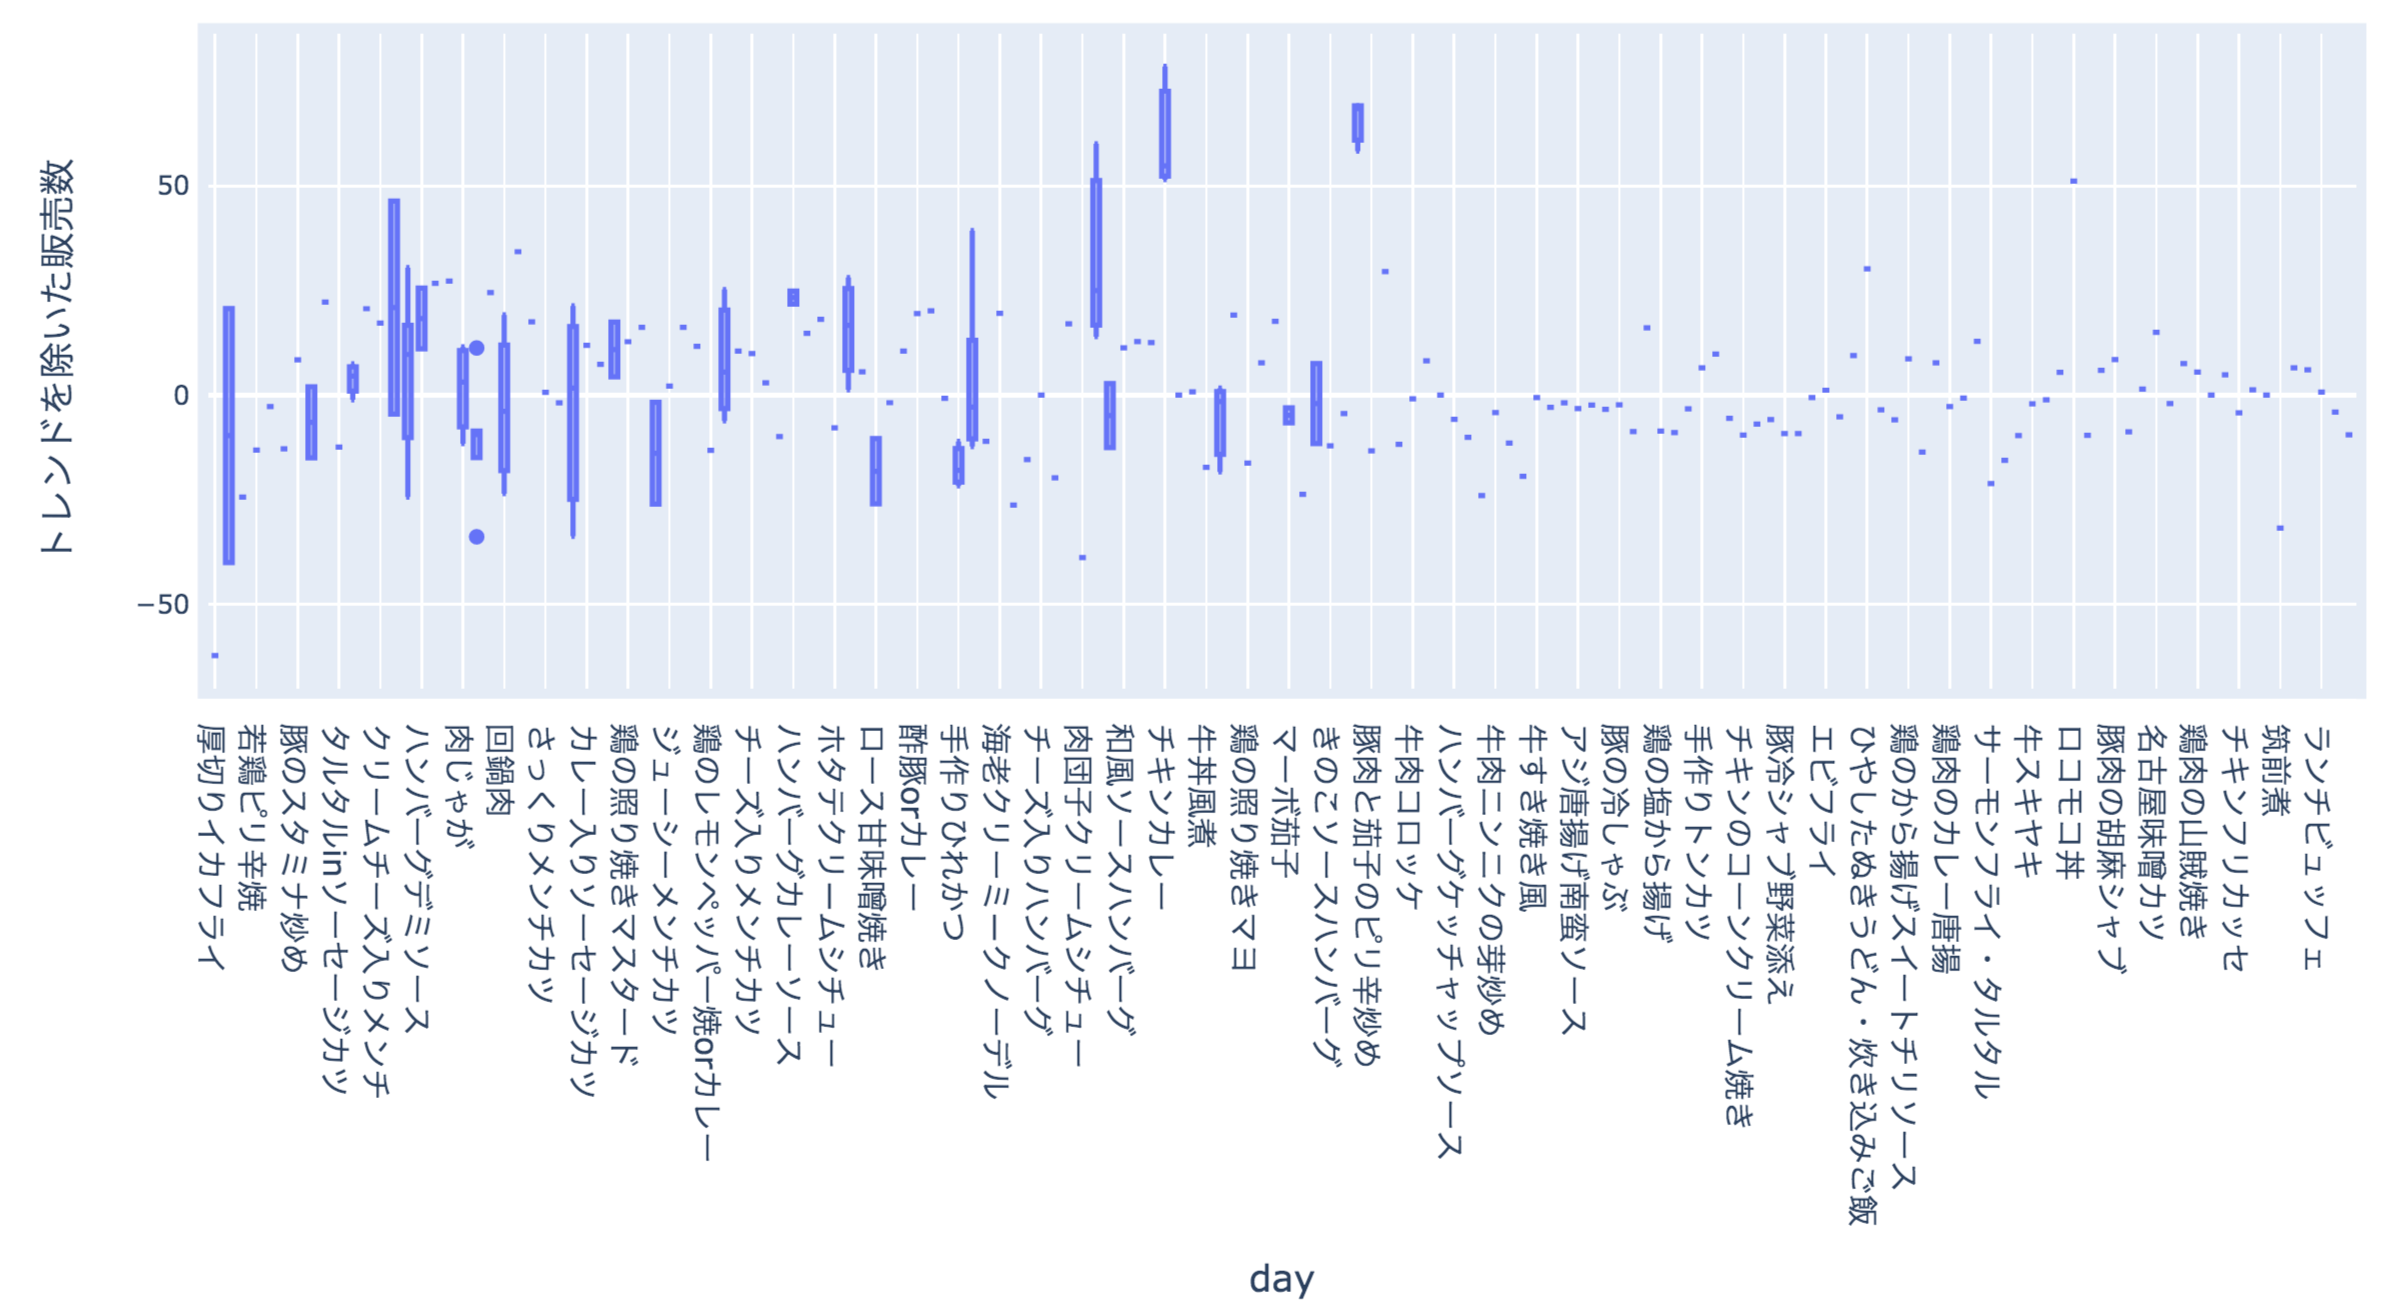
train['curry'] = train['name'].apply(lambda x : 1 if x.find("カレー") >=0 else 0)data = [go.Box( x=train['curry'], y=train['new_new_y'] )]
fig = go.Figure(data=data, layout=layout)
offline.iplot(fig, filename='example', show_link=False,
config={"displaylogo":False, "modeBarButtonsToRemove":["sendDataToCloud"]})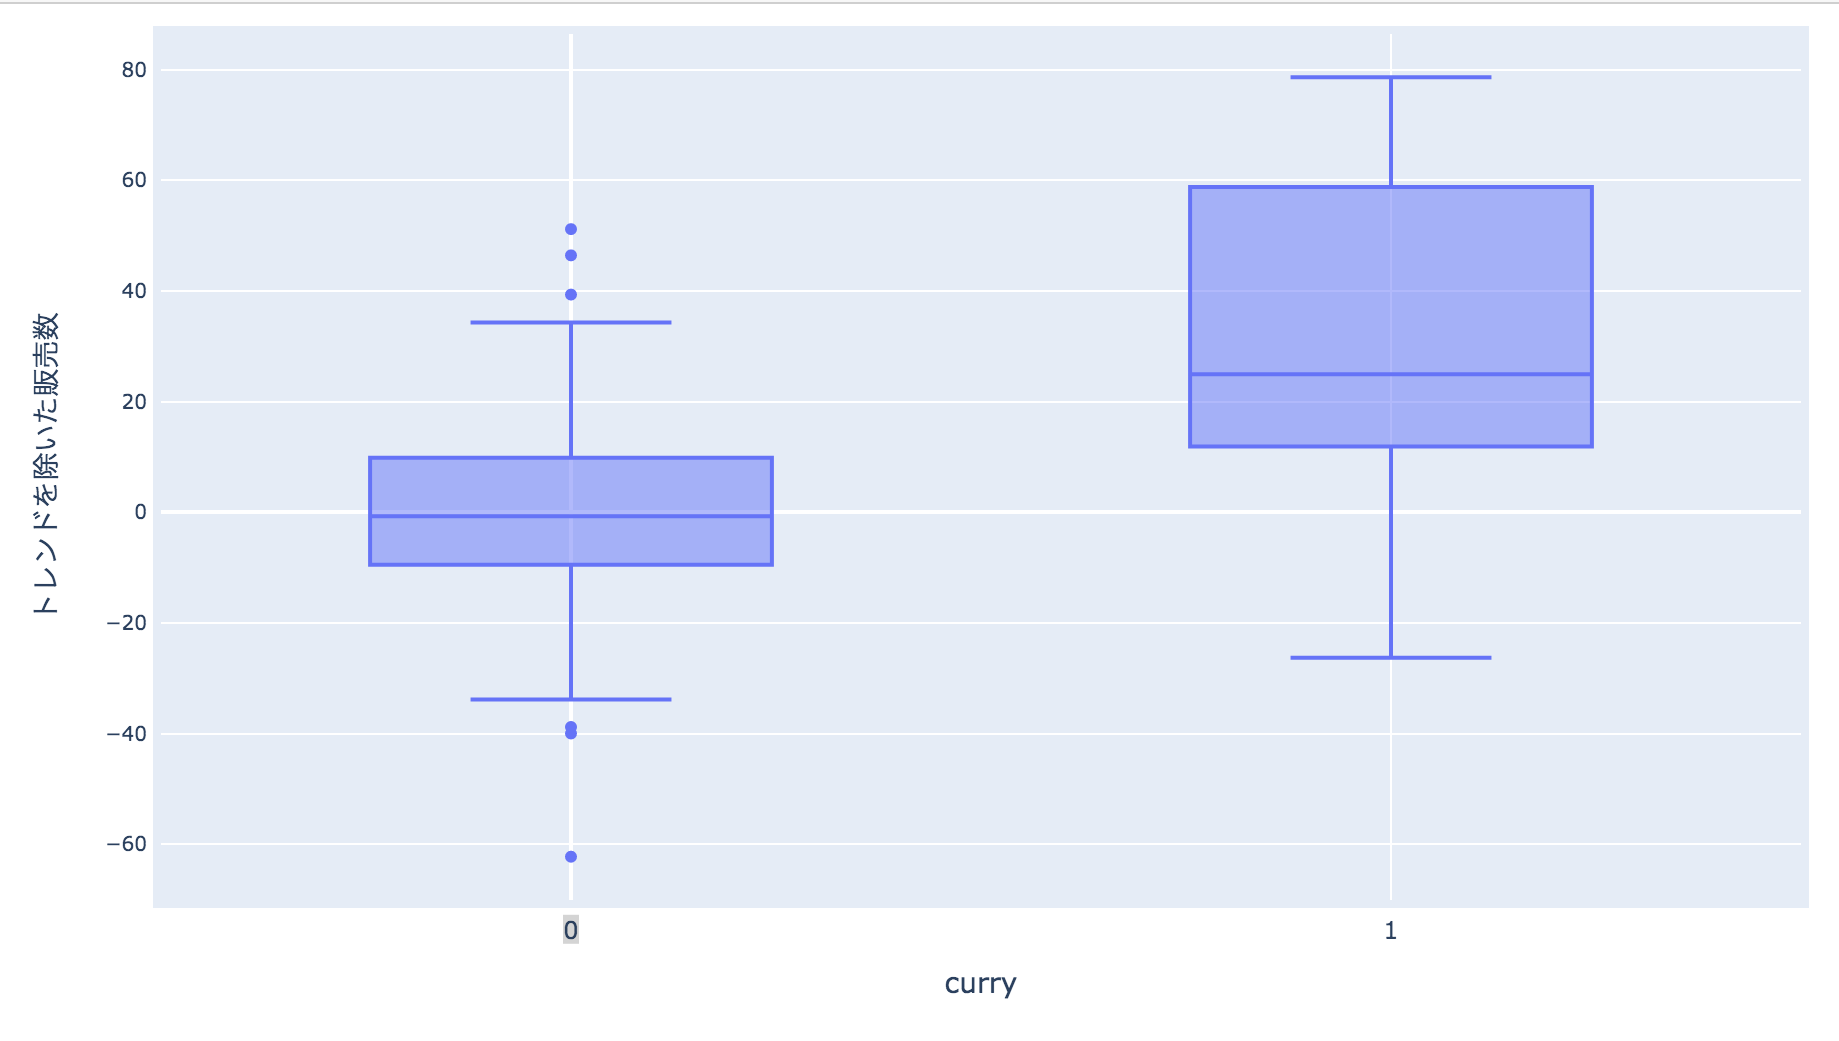
popular_menu = set(train[train['new_new_y']>15].name){'さんま辛味焼',
'ひやしたぬきうどん・炊き込みご飯',
'やわらかロースのサムジョン',
'カキフライタルタル',
'キーマカレー',
'クリームチーズ入りメンチ',
'サバ焼味噌掛け',
'チキンカレー',
'チンジャオロース',
'チーズハンバーグ',
'ハンバーグ',
'ハンバーグカレーソース',
'ハンバーグデミソース',
'ポークカレー',
'ポークハヤシ',
'ポーク味噌焼き',
'メンチカツ',
'ロコモコ丼',
'五目御飯',
'厚揚げ豚生姜炒め',
'名古屋味噌カツ',
'回鍋肉',
'手作りヒレカツ',
'手作りロースカツ',
'海老クリーミ―クノーデル',
'牛丼',
'牛肉筍煮',
'豚味噌メンチカツ',
'酢豚',
'酢豚orカレー',
'鶏のカッシュナッツ炒め',
'鶏のピリ辛焼き',
'鶏の唐揚げおろしソース',
'鶏の唐揚げ甘酢あん',
'鶏の親子煮',
'鶏チリソース'}
train['popular'] = train['name'].apply(lambda x : 1 if x in popular_menu else 0)unpopular_menu = set(train[train['new_new_y']<-15].name)
train['unpopular'] = train['name'].apply(lambda x : 1 if x in unpopular_menu else 0)train['kcal'] = train['kcal'].fillna(train['kcal'].mean())data = [go.Box( x=train['remarks'], y=train['new_new_y'] )]
fig = go.Figure(data=data, layout=layout)
offline.iplot(fig, filename='example', show_link=False,
config={"displaylogo":False, "modeBarButtonsToRemove":["sendDataToCloud"]})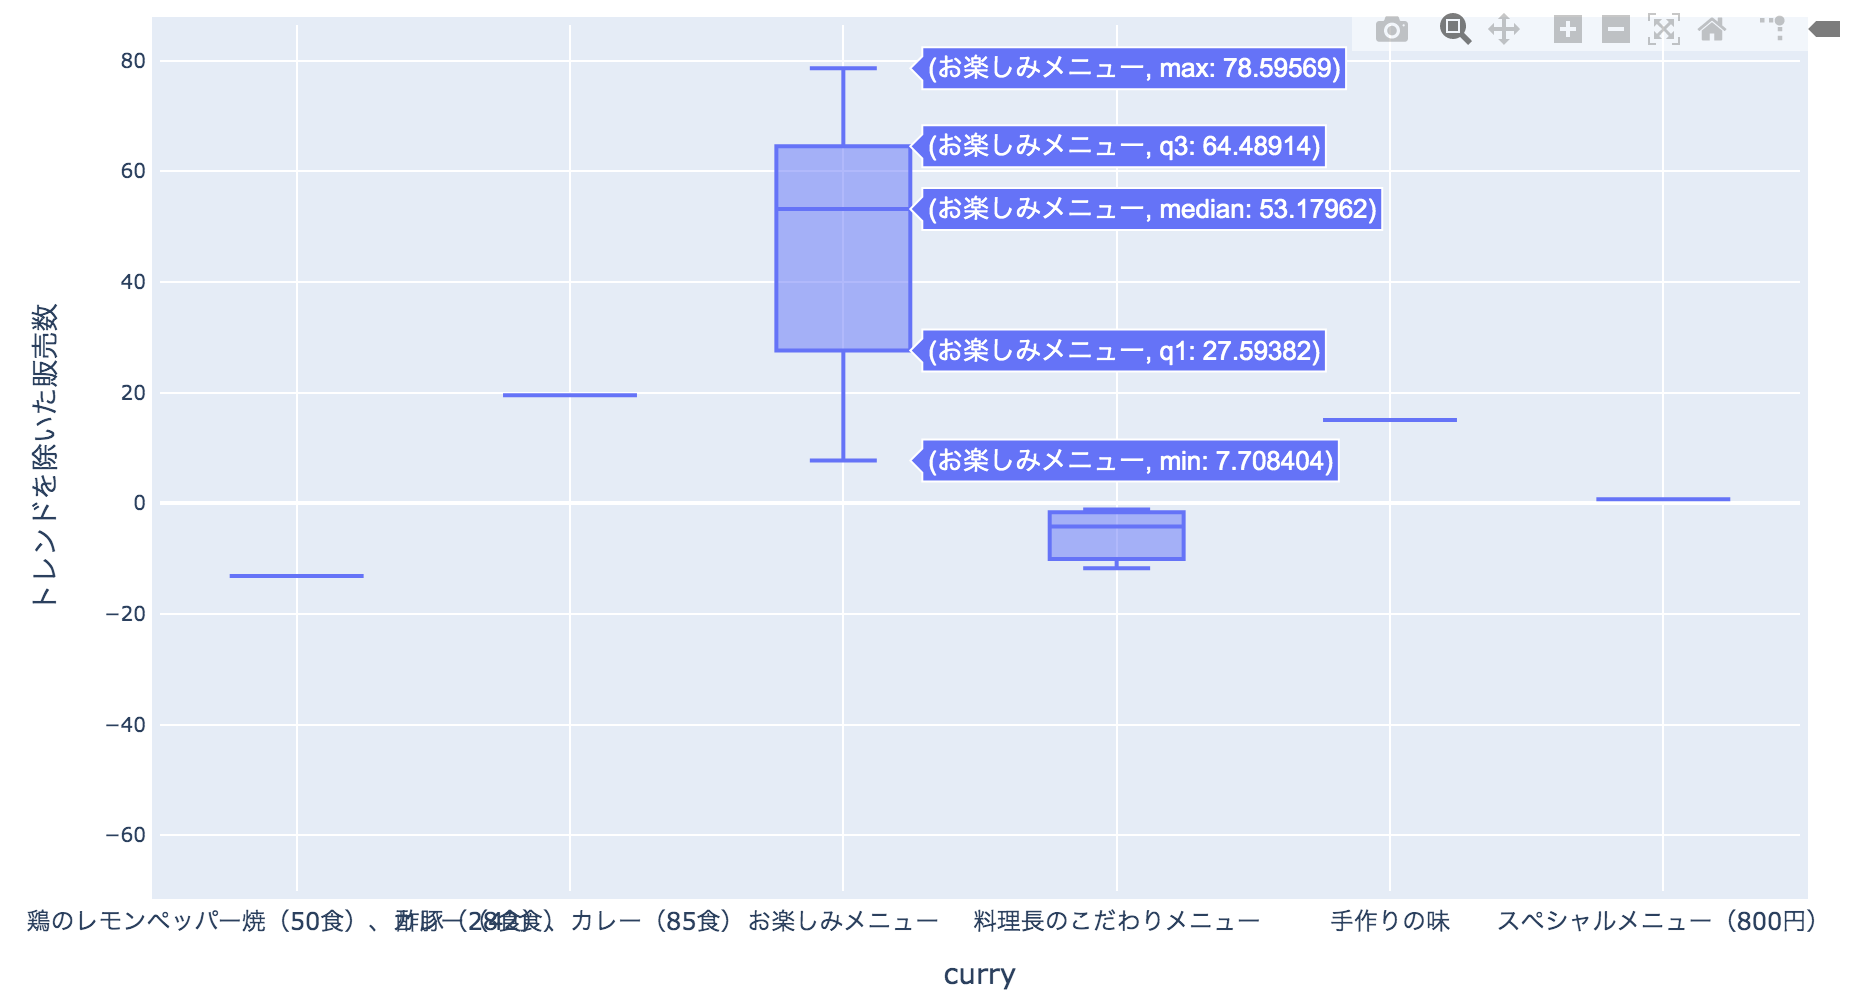
train['fun'] = train['remarks'].apply(lambda x: 1 if x=="お楽しみメニュー" else 0)train['payday'] = train['payday'].fillna(0)weather_word = ['快晴','晴','曇','雨','雪','雷']
row_index = []
number = 1
for x in weather_word:
row_index = train['weather'].str.contains(x, na=False)
train.loc[row_index, ['weather']] = number
if number < 4:
number += 1
else:
number = 4
row_index = []
weather_encoded = train.groupby('weather').new_y.median()
train['weather'] = train['weather'].replace(weather_encoded)train = train.drop(columns = ['precipitation'])train['month'] = train['datetime'].apply(lambda x : int(x.split("-")[1]))
temp_mean = train.groupby('month').temperature.mean()
train['month'] = train['month'].replace(temp_mean)
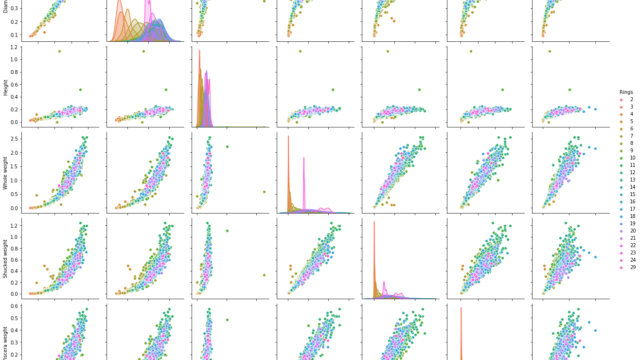
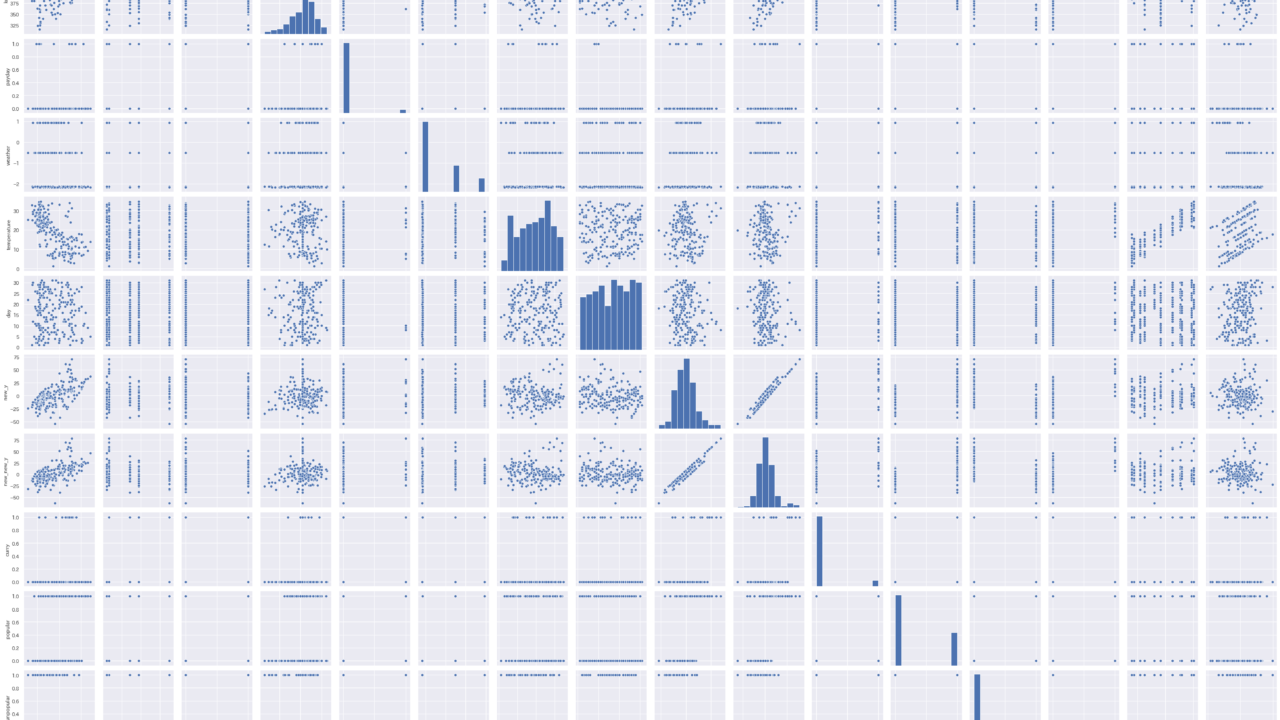
train['temp'] = train['temperature'] - train['month']sns.pairplot(train)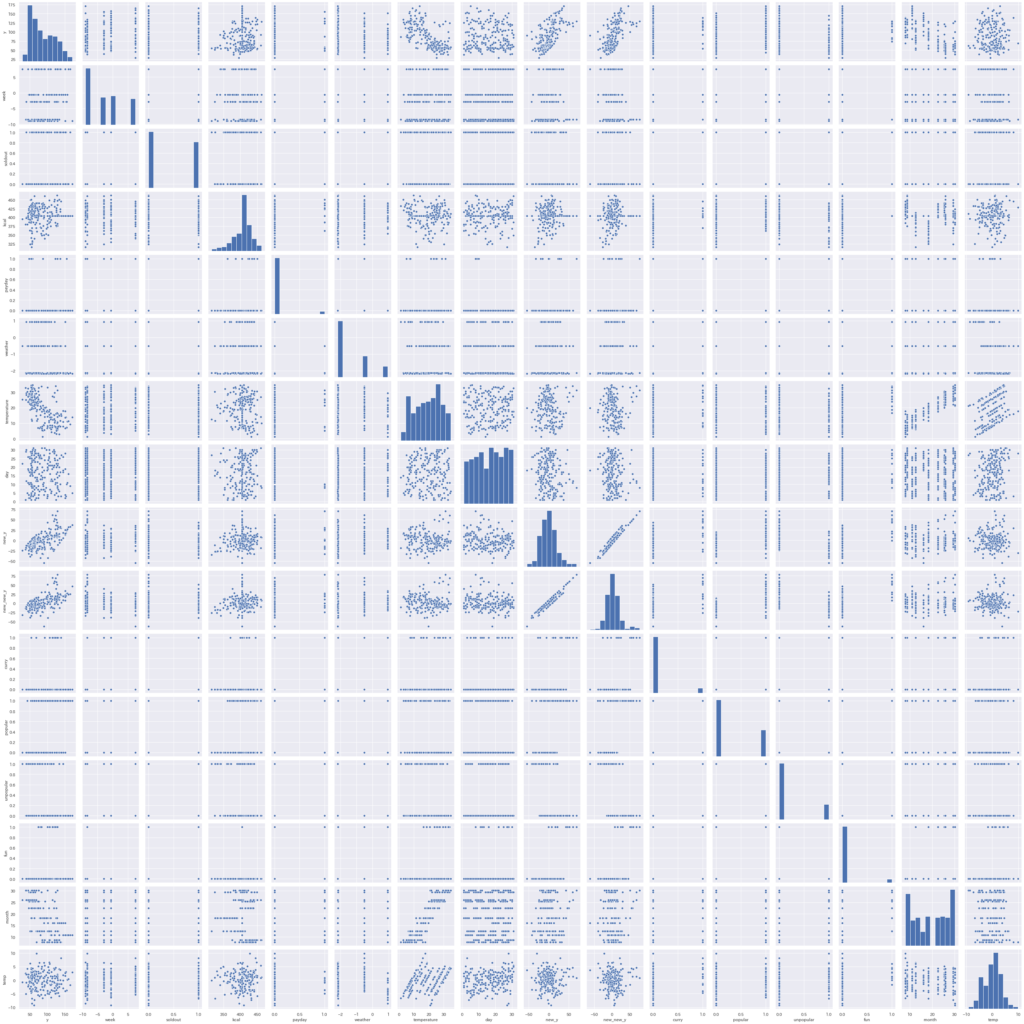
base = ['soldout','kcal','day','payday','temperature','temp']
weather = ['weather']
week = ['week']
name = ['fun','curry','popular','unpopular']
annotation = ['beef','pork','chicken','fish','other','vegi','japanese','chinese',
             'western','grilled','sauteed','stewed','fried','steamed']

feature_x = base + weather + week + name
# feature_x = base + weather + week + name + annotation
feature_y = ['new_y']

data_x = train[feature_x]
data_y = train[feature_y]
from sklearn.ensemble import RandomForestRegressor
rf_reg = RandomForestRegressor(n_estimators=10000)
rf_reg = rf_reg.fit(data_x, data_y)
fti = rf_reg.feature_importances_
dic_arr = {'importance':fti, 'feature':feature_x}
pd.DataFrame(dic_arr).sort_values('importance', ascending=False).reset_index(drop=True).loc[:15, :]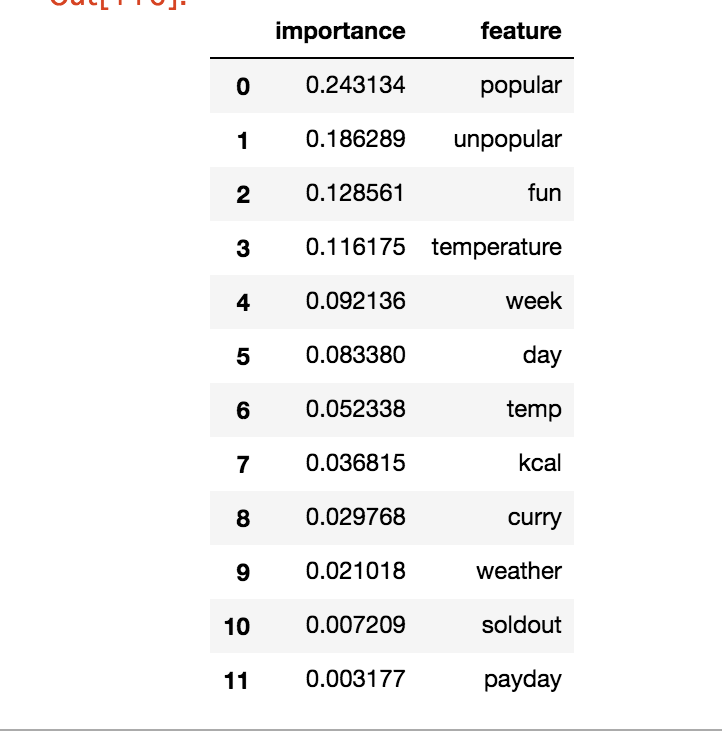
import lightgbm as lgb

clf = lgb.LGBMRegressor()
clf.fit(data_x[feature_x], data_y[feature_y])
print ('Score: ',clf.score(data_x[feature_x], data_y[feature_y]))#正解率の表示
Score: 0.8703440689894268
train['new_y'] = clf.predict(data_x[feature_x])

original = train['y']
pred_y = train['new_y']
final_train = y_reg + pred_y

plt.figure()
plt.plot(original, label='original', linestyle='-')
plt.plot(final_train, label='trend + pred_y', linestyle='-')
plt.legend(loc='best')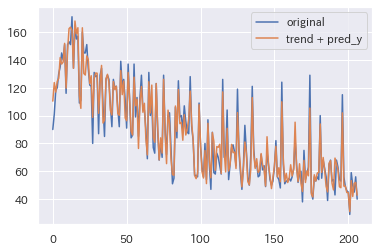
参考記事
SIGNATE お弁当の売り上げをLightGBMで予測してみた