ここでは決定木とランダムフォレストを使った機械学習のプログラム例について解説していきます。
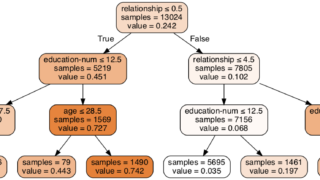
決定木はフロー図を可視化できるtree.export_graphvizを利用することで学習結果を見える化できます。
ランダムフォレストではk分割交差検証を行うことで正解率が89%まで向上しました。
決定木を使った手法
各種ライブラリのインポートとデータの読み込み
※インポートは本記事では不要なものも含んでいます
import pandas as pd
import numpy as np
import seaborn as sns
import sklearn.preprocessing as sp
from sklearn.linear_model import LogisticRegression
from sklearn.ensemble import RandomForestClassifier
from sklearn import tree
import lightgbm as lgb
from sklearn.metrics import confusion_matrix
from sklearn.metrics import accuracy_score

train=pd.read_csv('./train.csv')
test=pd.read_csv('./test.csv')
sample=pd.read_csv('./sample_submit.csv')
読み込んだデータフレームの中身を見てみます。
null値(欠損データ)とデータ型を確認できるdtypesを使うと簡単に確認できます。
train.dtypes<class 'pandas.core.frame.DataFrame'> RangeIndex: 891 entries, 0 to 890 Data columns (total 12 columns): # Column Non-Null Count Dtype --- ------ -------------- ----- 0 id 891 non-null int64 1 Age 891 non-null int64 2 Gender 891 non-null object 3 T_Bil 891 non-null float64 4 D_Bil 891 non-null float64 5 ALP 891 non-null float64 6 ALT_GPT 891 non-null float64 7 AST_GOT 891 non-null float64 8 TP 891 non-null float64 9 Alb 891 non-null float64 10 AG_ratio 887 non-null float64 11 disease 891 non-null int64 dtypes: float64(8), int64(3), object(1) memory usage: 83.7+ KB
相関係数などの可視化
肝疾患判定に影響していそうな変数を探すため、seabornのヒートマップグラフを用いて可視化してみます。
sns.heatmap(train.corr(),annot=True)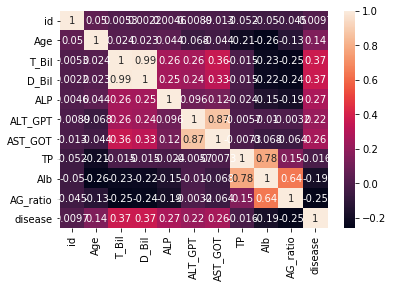
さらに、seabornのペアプロットで各変数の関係も可視化してみます。
sns.pairplot(train,hue='disease')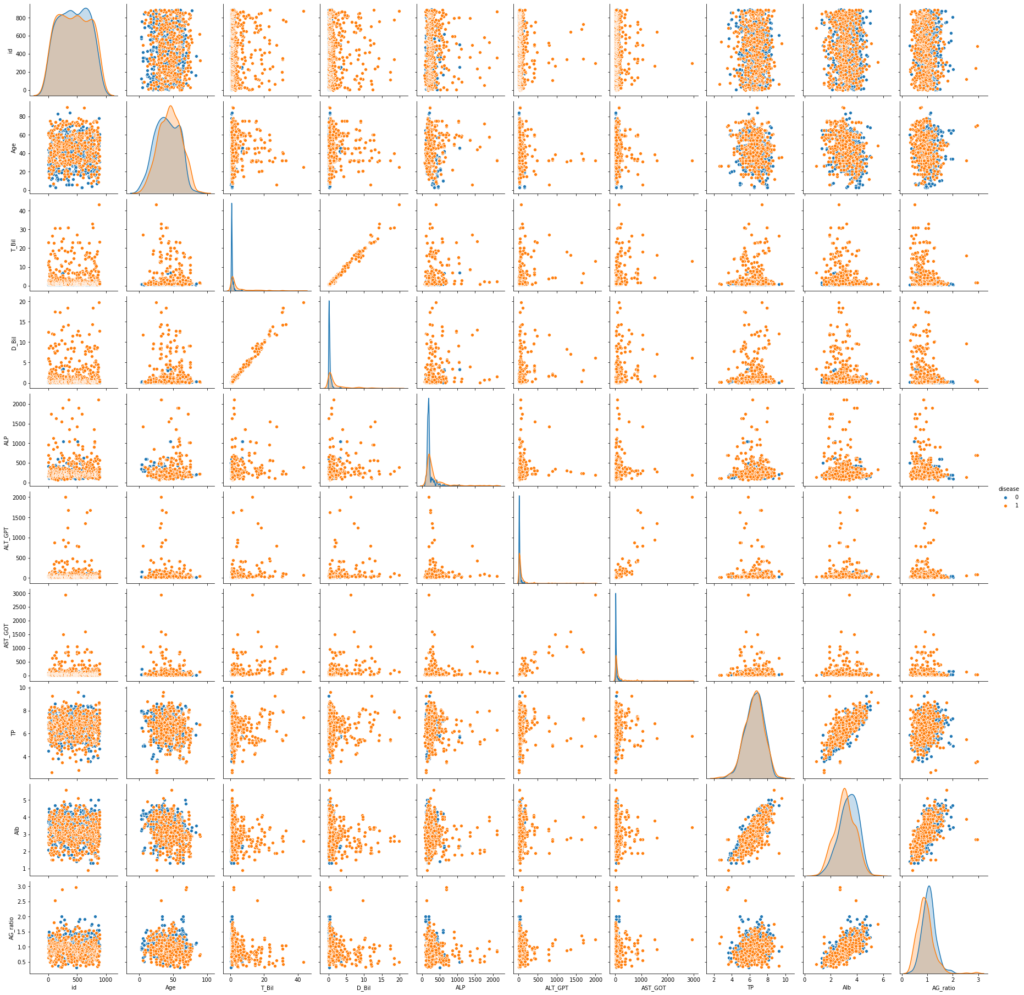
seabornでよく使うFacetGrid
y軸を共通として2種以上の項目で比較する際に便利です。
今回は年齢と肝疾患判定の関係性を表現してみました。
年齢は疾患に有意な影響は無いように見えます。
grid = sns.FacetGrid(train, col='disease')
grid.map(sns.distplot, 'Age')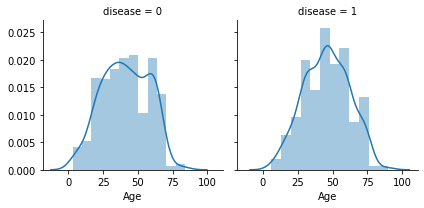
コード中身
clf=に続く部分で使用する機械学習手法を選べます。
ロジスティック回帰やランダムフォレストも記載していますが今回は決定木(tree.DecisonTreeRegressor)を指定して実行します。
tree.export_graphvizを使用すると決定木の中身を可視化できるので決定木を使用する際には積極的に利用しましょう。
drop_col = ['id', 'Age','Gender','AG_ratio']

y_train=train['disease']
X_train=train.drop(drop_col, axis=1)
X_train=X_train.drop('disease', axis=1)
X_test=test.drop(drop_col, axis=1)


# clf = LogisticRegression(penalty='l2', solver='sag', random_state=0)
# clf = RandomForestClassifier(n_estimators=100, max_depth=20, random_state=1)
clf = tree.DecisionTreeRegressor(max_depth=20, random_state=1)
clf.fit(X_train, y_train)

y_pred = clf.predict(X_test)

for i in range(382):
    if y_pred[i]>=0.5:
        y_pred[i]=1
    else:
        y_pred[i]=0

sub['disease'] = list(map(int, y_pred))
sub['id'] = test['id']
sub.to_csv('submission.csv', index=False)

features = X_train.columns

with open("tree.dot", 'w') as f:
    tree.export_graphviz(
        clf,
        out_file=f,
        feature_names=features,
        filled=True,
        rounded=True,
        special_characters=True,
        impurity=False,
        proportion=False,
        class_names=list(map(str, range(0, np.max(kmeans_result)+1)))
)作成した多数の決定木の中身を知る
graph = pydotplus.graphviz.graph_from_dot_file('tree.dot')
graph.write_png('tree.png')
Image(graph.create_png())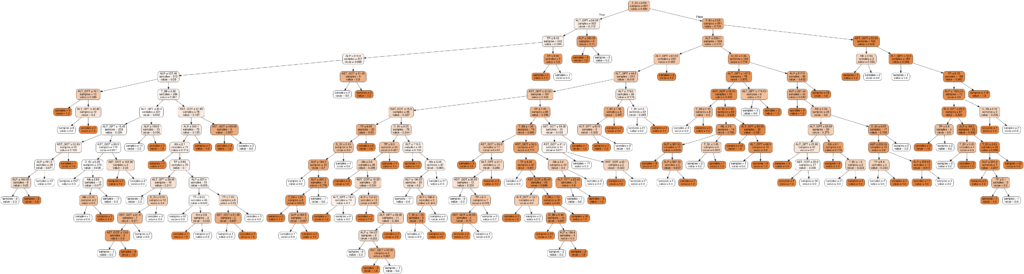
分岐が多すぎるので見にくいです。。。
多すぎると過学習になってしまうので、分岐は少な過ぎず、多すぎないところで高い正解率が出るパラメータを探せると汎化性能がよくなるはずです。
ランダムフォレストを使った手法
各種ライブラリのインポートとデータの読み込み
import pandas as pd
import numpy as np
import seaborn as sns
import sklearn.preprocessing as sp
import pydotplus
from IPython.display import Image
from sklearn.linear_model import LogisticRegression
from sklearn.ensemble import RandomForestClassifier
from sklearn import tree
# LightGBM
import lightgbm as lgb
# Scikit-learn(評価算出)
from sklearn.metrics import confusion_matrix
from sklearn.metrics import accuracy_score

train=pd.read_csv('./train.csv')
test=pd.read_csv('./test.csv')
sub=pd.read_csv('./sub.csv')

# drop_col = ['id', 'Age','Gender','ALP','ALT_GPT','AST_GOT','TP','Alb','AG_ratio']:78
# drop_col = ['id', 'Age','Gender','AST_GOT','TP','Alb','AG_ratio']:74
drop_col = ['id', 'Age','Gender','AG_ratio']

y_train=train['disease']
X_train=train.drop(drop_col, axis=1)
X_train=X_train.drop('disease', axis=1)
X_test=test.drop(drop_col, axis=1)


# clf = LogisticRegression(penalty='l2', solver='sag', random_state=0)
clf = RandomForestClassifier(n_estimators=100, max_depth=20, random_state=1)
# clf = tree.DecisionTreeRegressor(max_depth=20, random_state=1)
clf.fit(X_train, y_train)

y_pred = clf.predict(X_test)

for i in range(382):
    if y_pred[i]>=0.5:
        y_pred[i]=1
    else:
        y_pred[i]=0

sub['disease'] = list(map(int, y_pred))
sub['id'] = test['id']
sub.to_csv('submission.csv', index=False)

features = X_train.columns
このコードでは正解率が70~80%とあまり高い成績は残せませんでした。
k分割交差検証を使ったランダムフォレスト全文(正解率:89%)
そこで、k分割交差検証を実装してランダムフォレストの再トライをしてみました。
※k分割交差検証については参考サイトをご覧ください
import pandas as pd
import numpy as np
import seaborn as sns
import sklearn.preprocessing as sp
import pydotplus
from IPython.display import Image
from sklearn.model_selection import train_test_split
from sklearn.linear_model import LogisticRegression
from sklearn.ensemble import RandomForestClassifier
from sklearn import tree
# LightGBM
import lightgbm as lgb
# Scikit-learn(評価算出)
from sklearn.metrics import confusion_matrix
from sklearn.metrics import accuracy_score
from sklearn.model_selection import StratifiedKFold
from sklearn.model_selection import StratifiedKFold, cross_val_score
from sklearn import metrics

train=pd.read_csv('./train.csv')
test=pd.read_csv('./test.csv')
sub=pd.read_csv('./sub.csv')

# drop_col = ['id', 'Age','Gender','ALP','ALT_GPT','AST_GOT','TP','Alb','AG_ratio']:正解率78%
# drop_col = ['id', 'Age','Gender','AST_GOT','TP','Alb','AG_ratio']:正解率74%
drop_col = ['id', 'Age','Gender','AG_ratio']

y_train=train['disease']
X_train=train.drop(drop_col, axis=1)
X_train=X_train.drop('disease', axis=1)
X_test=test.drop(drop_col, axis=1)

X_train, X_test, y_train, y_test = train_test_split(X_train, y_train, test_size=0.1, random_state=0)

clf = RandomForestClassifier(n_estimators=100, max_depth=18, random_state=1)
clf.fit(X_train, y_train)

print ('Score: ',clf.score(X_test, y_test))#正解率の表示

#K分割交差検証
stratifiedkfold = StratifiedKFold(n_splits=5)  #K=10分割
scores = cross_val_score(clf, X_train, y_train, cv=stratifiedkfold)
print('Cross-Validation scores: {}'.format(scores))   # 各分割におけるスコア
print('Average score: {}'.format(np.mean(scores)))  # スコアの平均値


for i in range(382):
    if y_pred[i]>=0.5:
        y_pred[i]=1
    else:
        y_pred[i]=0

sub['disease'] = list(map(int, y_pred))
sub['id'] = test['id']
sub.to_csv('submission.csv', index=False)
signate練習問題に興味のある方はこちらへ
https://cafe-mickey.com/tag/signate/
参考記事
【Python】DataFrameで複数行・列をまとめて削除する
初心者がデータ分析コンペにチャレンジしてみた!【SIGNATE】【タイタニック号の生存予測】
kaggleに挑戦その4 k分割交差検証(k-fold cross-validation)及びグリッドサーチ