ファイルの読み込み
import pandas as pd
import numpy as np

train=pd.read_table('./train.tsv')
test=pd.read_table('./test.tsv')
データの中身を確認
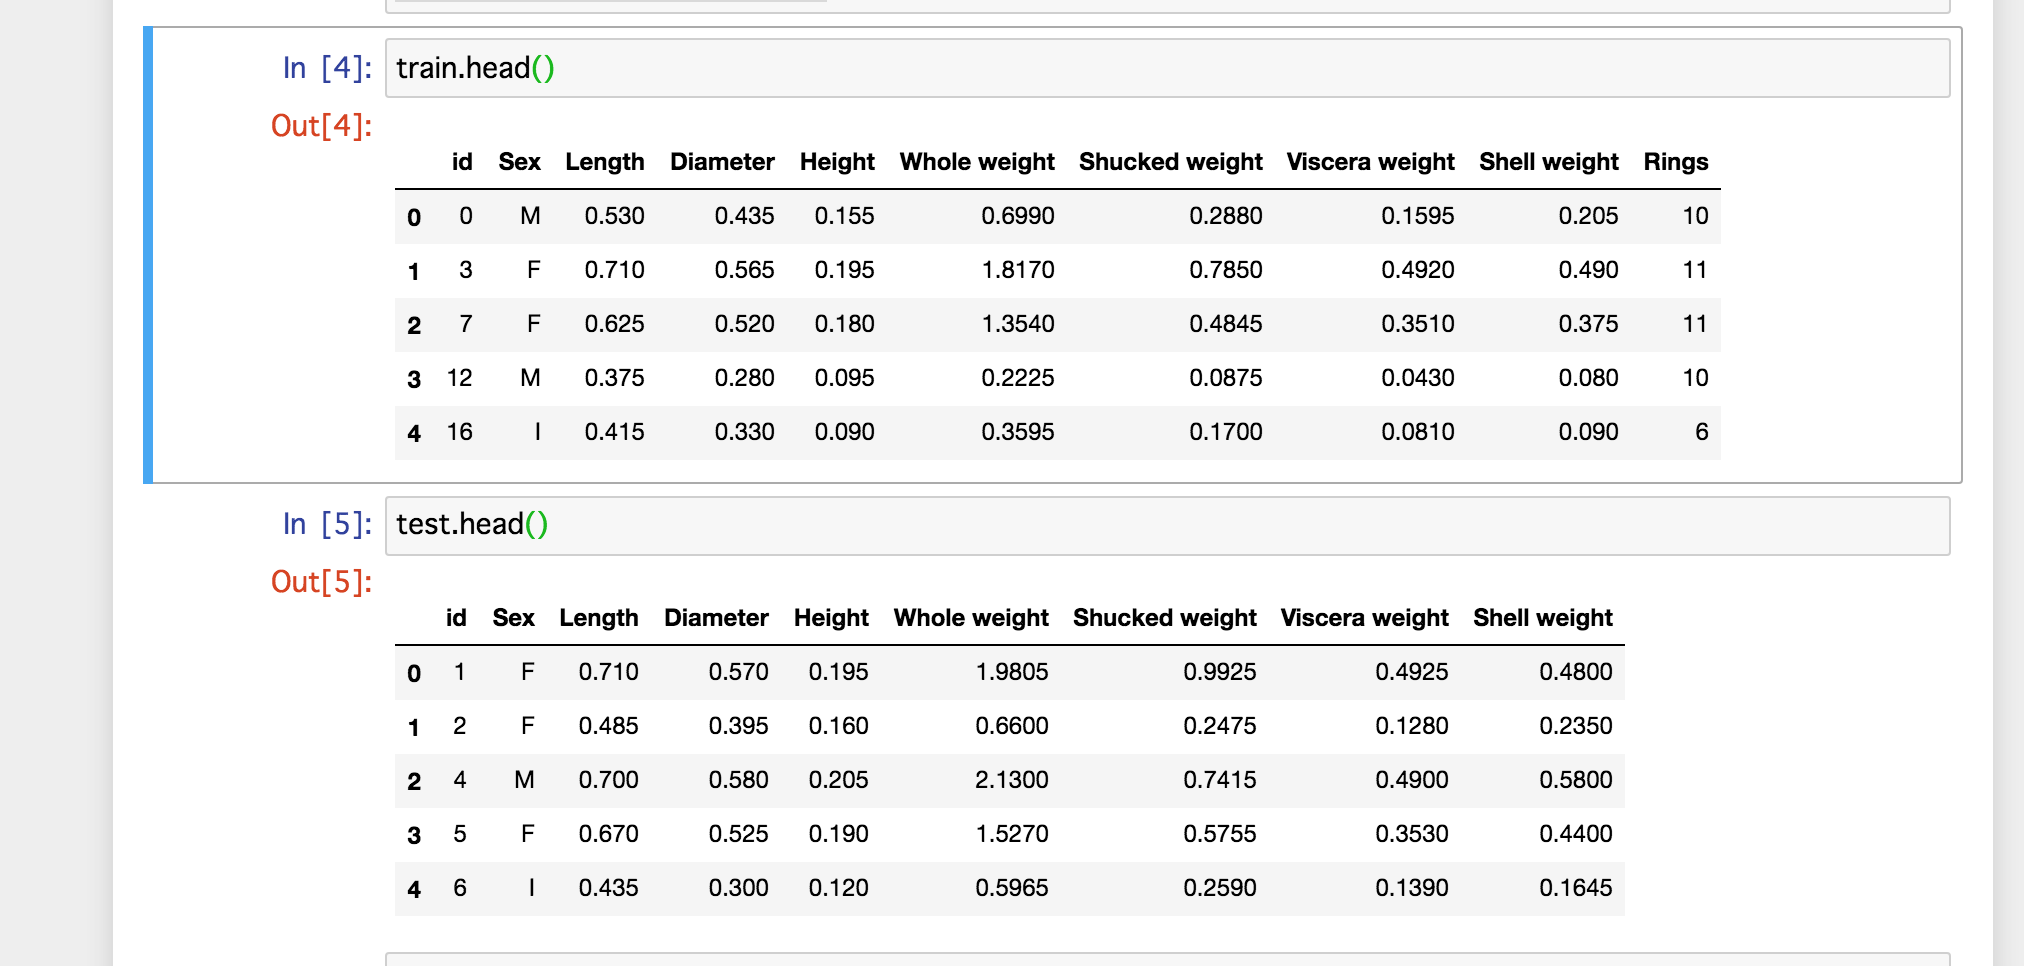
train.info()<class 'pandas.core.frame.DataFrame'> RangeIndex: 2088 entries, 0 to 2087 Data columns (total 10 columns): # Column Non-Null Count Dtype --- ------ -------------- ----- 0 id 2088 non-null int64 1 Sex 2088 non-null object 2 Length 2088 non-null float64 3 Diameter 2088 non-null float64 4 Height 2088 non-null float64 5 Whole weight 2088 non-null float64 6 Shucked weight 2088 non-null float64 7 Viscera weight 2088 non-null float64 8 Shell weight 2088 non-null float64 9 Rings 2088 non-null int64 dtypes: float64(7), int64(2), object(1) memory usage: 163.2+ KB
データの前処理
SexだけObjectになっているのでどんな文字があるのか確認してみます
train['Sex'].unique()array([‘M’, ‘F’, ‘I’], dtype=object)
M,F,Iの3種で構成されている事が分かりました。(Iってなんだっけ?)
数値に変換しておくと何かと便利なので変換します。
train['Sex'] = train['Sex'].replace(['M', 'F', 'I'], [int(1), int(2), int(3)])データ間における相関係数の確認
ここではseabornを使って相関係数の一覧を表示させます。
seaborn導入は一文入力するだけで完了です。
pip install seabornそれでは実際に表示させて見ましょう。
※3行目:idは必要ないので削除しておきます
import seaborn as sns
df=train
df=df.drop('id',axis=1)
sns.heatmap(df.corr(),annot=True)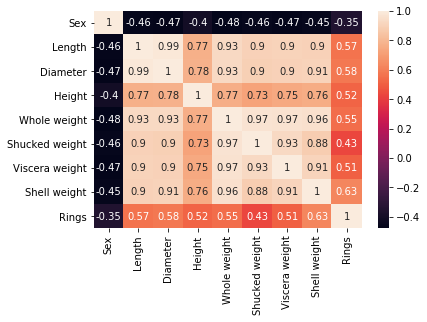
年齢(Rings)とはShell weghtと正の相関がある、他にもSex以外とは正の相関がありそうな事がよくわかります。
次にヒストグラムで分布の確認をして見ましょう。
年齢と関係する因子の確認
df=df.drop('Sex',axis=1)
sns.pairplot(df,hue='Rings')
Sexは削除して表示させます。(エラーが出たため)
年齢毎に色分けして表示させます。
自分同士のグラフはヒストグラム(対角上)、その他は散布図プロットになります。
いろいろなパラメータが線形関係になっていそうです。
ヒストグラムで年齢が低いものと高いものではっきり分かれているLength,Viscera weight,Shell weightあたりが目につきます。
※その他にもこの図から考察はできますが、今回は解析がメインではないので、詳細の考察は省略します。

プログラム全体(決定木を使った解析)
import pandas as pd
import numpy as np
from sklearn.linear_model import LogisticRegression
from sklearn.ensemble import RandomForestClassifier
from sklearn import tree

train=pd.read_table('./train.tsv')
test=pd.read_table('./test.tsv')
sample=pd.read_csv('./sample_submit.csv')
sub=pd.read_csv('./sub.csv')

df=train
df=df.drop('id',axis=1)
df['Sex'] = df['Sex'].replace(['M', 'F', 'I'], [int(1), int(2), int(3)])

y_train=df['Rings']
X_train=df.drop('Rings',axis=1)

# clf = LogisticRegression(penalty='l2', solver='sag', random_state=0)
# clf = RandomForestClassifier(n_estimators=100, max_depth=2, random_state=0)
clf = tree.DecisionTreeRegressor(max_depth=3, random_state=0)

clf.fit(X_train, y_train)

df=test
df=df.drop('id',axis=1)
df['Sex'] = df['Sex'].replace(['M', 'F', 'I'], [int(1), int(2), int(3)])

y_pred = clf.predict(df)
sub['Rings'] = list(map(int, y_pred))
sub.to_csv('submission.csv', index=False)
完成した決定木を確認
事前にpydotplusのインストールが必要です
conda config --add channels conda-forge conda install pydotplusインストール後はインポートして実行するだけ
import pydotplus
from IPython.display import Image

graph = pydotplus.graphviz.graph_from_dot_file('tree.dot')
graph.write_png('tree.png')
Image(graph.create_png())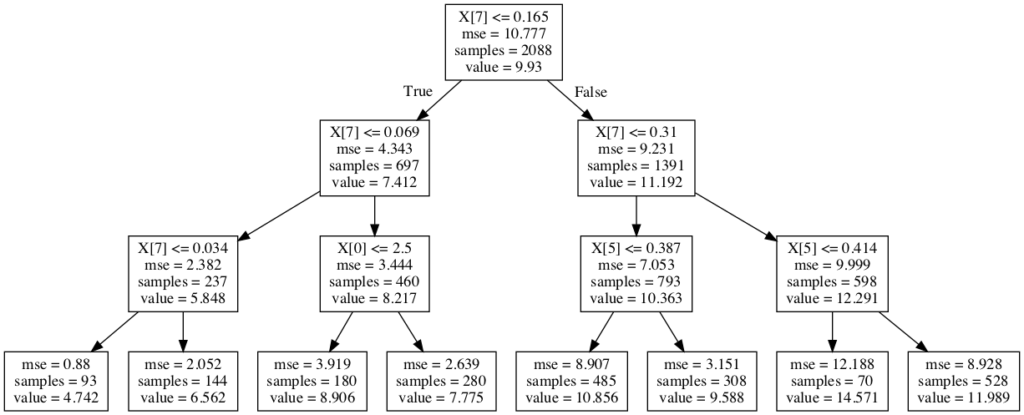
決定木の重要因子を表示することもできます。
print(pd.Series(clf.feature_importances_))0 0.014257 1 0.000000 2 0.000000 3 0.000000 4 0.000000 5 0.072808 6 0.000000 7 0.912935 dtype: float64
7番目の項目にかなり依存しているようです。
infoで確認すると7番目はShell weightです。
df.info()<class 'pandas.core.frame.DataFrame'> RangeIndex: 2089 entries, 0 to 2088 Data columns (total 8 columns): # Column Non-Null Count Dtype --- ------ -------------- ----- 0 Sex 2089 non-null int64 1 Length 2089 non-null float64 2 Diameter 2089 non-null float64 3 Height 2089 non-null float64 4 Whole weight 2089 non-null float64 5 Shucked weight 2089 non-null float64 6 Viscera weight 2089 non-null float64 7 Shell weight 2089 non-null float64 dtypes: float64(7), int64(1) memory usage: 130.7 KB
提出結果
評価結果:2.57 (203位/420人 2020年6月14日現在)
こんな簡単な数行のプログラムで上位5割にランクインという結果でした。
機械学習には様々な手法とそれに基づくパラメータがいくつも存在するので、テーマに合った手法の選択と合理的な前処理で精度を向上させる事が可能です。
ぜひ試して見てください。全く同じデータを用いた代表的な手法での結果は以下の通りとなりました。
◆ロジスティック回帰の場合
評価結果:2.8
◆ランダムフォレストの場合
評価結果:2.93
参考
決定木とかグラフ構造(dotファイル)をJupyter上で表示する